Sunday, May 19, 2024


Austin, Texas, saw a 102% jump in millionaires between 2012-2022. That, along with a $100 billion wealth migration to the Southeast, shows a shift in the economic center of the U.S.
The wealthiest American cities have shifted over time, subject to the rise in various industries and population growth. Stacker used Bureau of Economic Analysis data to determine the richest states by decade, ranking states by their annual personal incomes per capita in the first year of the decade. The BEA's numbers tend to be higher than other income measures since they include government transfers, dividends, and interest payments in addition to wages.
Our forthcoming list begins in 1930, when American workers earned $621 a year—the equivalent of nearly $8,900 in 2023, adjusting for inflation using the Personal Consumption Expenditures price index.
Washington D.C. tops the list for most of this period. The capital has historically been one of the best-educated cities in America. District of Columbia residents now make $100,900 a year on average. As the home of most federal agencies, the city has a large supply of jobs for both people who work for the government and with it.
Alaska also sits near the top of the list for most decades. It only shows up in the BEA's personal income dataset starting in 1950, nine years before it became a state. Its remote location and harsh weather conditions have meant employers have historically had to pay more to attract workers. The state also benefits from having a large stock of rich natural resources, including oil and gas. Much of the money generated by the state's oil industry goes to the Alaska Permanent Fund, which pays citizens who live in the state. Last year, the fund paid $1,312 per citizen.
One state that has slipped is Illinois. In 1960, it was the eighth-richest state in the country, prospering as a major industrial and trade hub. The state has dropped out to #15 in terms of personal income. Several factors have contributed to this decline. Like many other Midwestern states, its manufacturing sector was hit hard by globalization and automation. Illinois has also suffered from an unusually high amount of political corruption—four of its past 10 governors have ended up in prison.
Read on to see what the richest states are, by decade, since 1930.
#10. Rhode Island: $795 ($11,400 in 2023 dollars)
#9. Illinois: $810 ($11,600 in 2023 dollars)
#8. Nevada: $834 ($11,900 in 2023 dollars)
#7. Massachusetts: $842 ($12,000 in 2023 dollars)
#6. New Jersey: $851 ($12,200 in 2023 dollars)
#5. Delaware: $858 ($12,300 in 2023 dollars)
#4. California: $889 ($12,700 in 2023 dollars)
#3. Connecticut: $927 ($13,300 in 2023 dollars)
#2. New York: $1,042 ($14,900 in 2023 dollars)
#1. District of Columbia: $1,314 ($18,800 in 2023 dollars)

#10. Illinois: $758 ($13,100 in 2023 dollars)
#9. Rhode Island: $767 ($13,200 in 2023 dollars)
#8. Massachusetts: $793 ($13,700 in 2023 dollars)
#7. New Jersey: $830 ($14,300 in 2023 dollars)
#6. California: $856 ($14,700 in 2023 dollars)
#5. New York: $883 ($15,200 in 2023 dollars)
#4. Nevada: $902 ($15,500 in 2023 dollars)
#3. Connecticut: $931 ($16,000 in 2023 dollars)
#2. Delaware: $1,038 ($17,900 in 2023 dollars)
#1. District of Columbia: $1,221 ($21,000 in 2023 dollars)

#10. Washington: $1,797 ($17,300 in 2023 dollars)
#9. New Jersey: $1,820 ($17,500 in 2023 dollars)
#8. Illinois: $1,842 ($17,700 in 2023 dollars)
#7. New York: $1,868 ($18,000 in 2023 dollars)
#6. Connecticut: $1,918 ($18,400 in 2023 dollars)
#5. California: $1,947 ($18,700 in 2023 dollars)
#4. Delaware: $2,082 ($20,000 in 2023 dollars)
#3. Nevada: $2,089 ($20,100 in 2023 dollars)
#2. District of Columbia: $2,427 ($23,300 in 2023 dollars)
#1. Alaska: $2,899 ($27,900 in 2023 dollars)

#10. Massachusetts: $2,548 ($19,700 in 2023 dollars)
#9. Illinois: $2,698 ($20,900 in 2023 dollars)
#8. New Jersey: $2,712 ($21,000 in 2023 dollars)
#7. New York: $2,847 ($22,100 in 2023 dollars)
#6. Connecticut: $2,860 ($22,200 in 2023 dollars)
#5. Delaware: $2,873 ($22,300 in 2023 dollars)
#4. California: $2,931 ($22,700 in 2023 dollars)
#3. Nevada: $3,079 ($23,800 in 2023 dollars)
#2. District of Columbia: $3,125 ($24,200 in 2023 dollars)
#1. Alaska: $3,521 ($27,300 in 2023 dollars)
#10. Delaware: $4,724 ($28,800 in 2023 dollars)
#9. Maryland: $4,867 ($29,600 in 2023 dollars)
#8. New Jersey: $4,909 ($29,900 in 2023 dollars)
#7. New York: $4,920 ($30,000 in 2023 dollars)
#6. California: $4,965 ($30,200 in 2023 dollars)
#5. Connecticut: $5,158 ($31,400 in 2023 dollars)
#4. Nevada: $5,191 ($31,600 in 2023 dollars)
#3. District of Columbia: $5,528 ($33,700 in 2023 dollars)
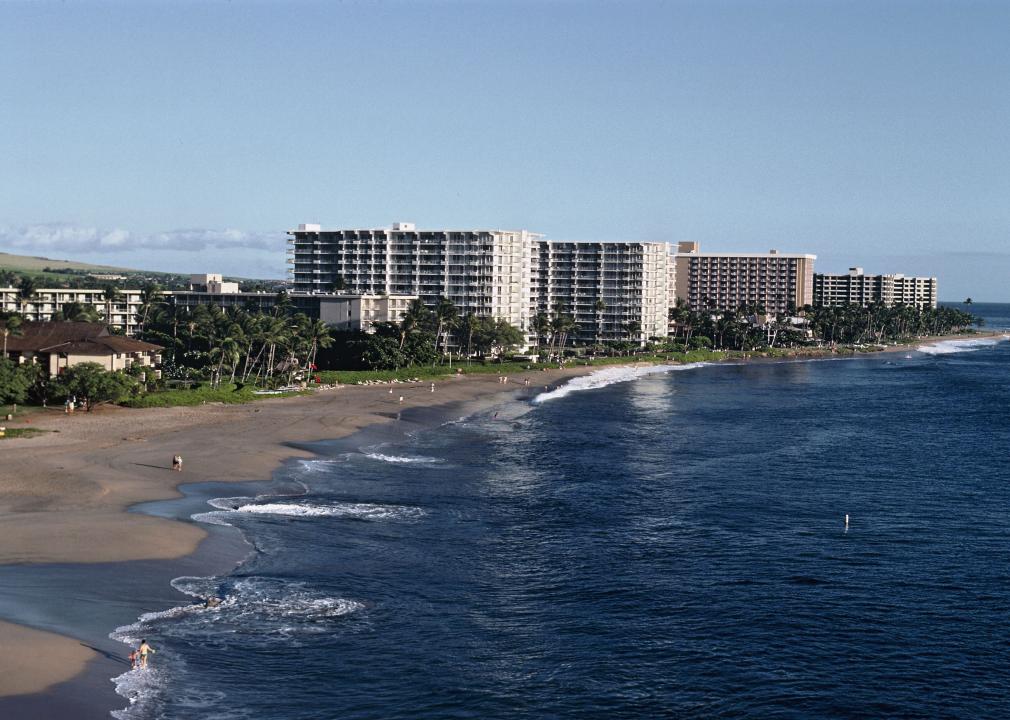
#2. Hawaii: $5,538 ($33,700 in 2023 dollars)
#1. Alaska: $5,911 ($36,000 in 2023 dollars)

#10. Washington: $11,133 ($34,400 in 2023 dollars)
#9. Maryland: $11,477 ($35,500 in 2023 dollars)
#8. Wyoming: $11,614 ($35,900 in 2023 dollars)
#7. New Jersey: $11,806 ($36,500 in 2023 dollars)
#6. Hawaii: $11,872 ($36,700 in 2023 dollars)
#5. Nevada: $11,949 ($37,000 in 2023 dollars)
#4. California: $11,950 ($37,000 in 2023 dollars)
#3. Connecticut: $12,371 ($38,300 in 2023 dollars)
#2. District of Columbia: $13,234 ($40,900 in 2023 dollars)
#1. Alaska: $15,507 ($48,000 in 2023 dollars)
#10. Delaware: $21,462 ($43,200 in 2023 dollars)
#9. California: $21,483 ($43,300 in 2023 dollars)
#8. Hawaii: $22,431 ($45,200 in 2023 dollars)
#7. Maryland: $23,104 ($46,500 in 2023 dollars)
#6. Massachusetts: $23,115 ($46,600 in 2023 dollars)
#5. Alaska: $23,207 ($46,700 in 2023 dollars)
#4. New York: $23,992 ($48,300 in 2023 dollars)
#3. New Jersey: $24,755 ($49,900 in 2023 dollars)
#2. District of Columbia: $26,117 ($52,600 in 2023 dollars)
#1. Connecticut: $26,392 ($53,200 in 2023 dollars)

#10. California: $33,175 ($54,100 in 2023 dollars)
#9. Delaware: $33,810 ($55,100 in 2023 dollars)
#8. Colorado: $33,872 ($55,200 in 2023 dollars)
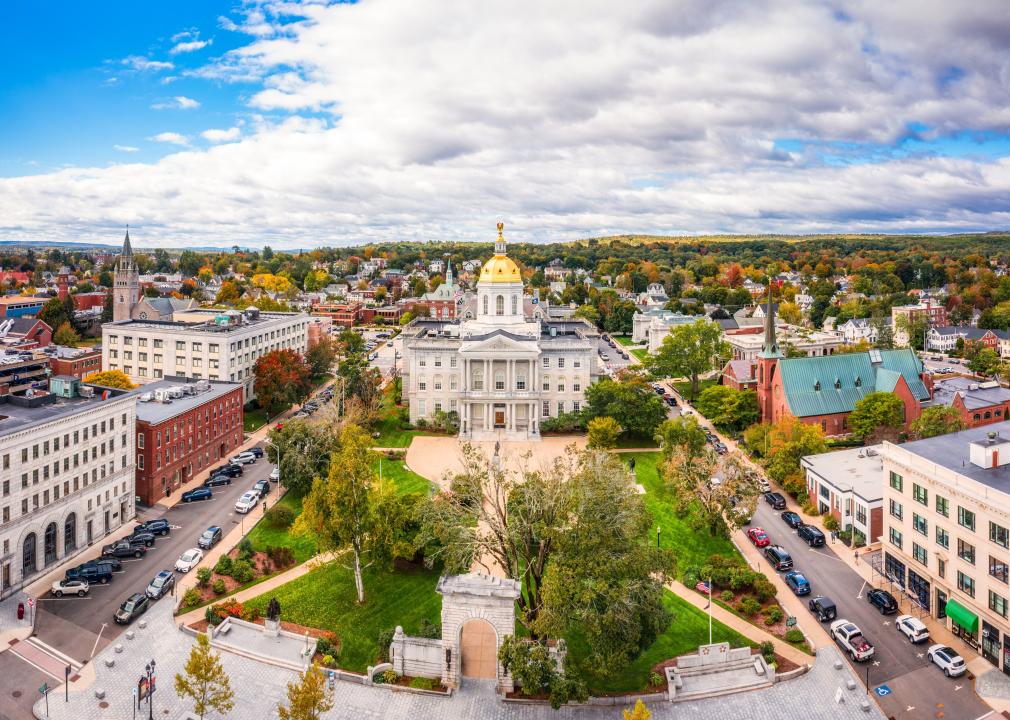
#7. New Hampshire: $35,323 ($57,600 in 2023 dollars)
#6. Maryland: $35,480 ($57,900 in 2023 dollars)
#5. New York: $35,955 ($58,600 in 2023 dollars)
#4. Massachusetts: $38,381 ($62,600 in 2023 dollars)
#3. New Jersey: $39,095 ($63,800 in 2023 dollars)
#2. Connecticut: $42,857 ($69,900 in 2023 dollars)
#1. District of Columbia: $43,401 ($70,800 in 2023 dollars)

#10. Virginia: $45,443 ($60,400 in 2023 dollars)
#9. Wyoming: $46,395 ($61,700 in 2023 dollars)
#8. New Hampshire: $46,983 ($62,500 in 2023 dollars)
#7. New York: $48,579 ($64,600 in 2023 dollars)
#6. Alaska: $49,543 ($65,900 in 2023 dollars)
#5. Maryland: $49,617 ($66,000 in 2023 dollars)
#4. New Jersey: $50,962 ($67,800 in 2023 dollars)
#3. Massachusetts: $52,708 ($70,100 in 2023 dollars)
#2. Connecticut: $61,392 ($81,600 in 2023 dollars)
#1. District of Columbia: $63,182 ($84,000 in 2023 dollars)

#10. Colorado: $64,848 ($74,600 in 2023 dollars)
#9. Wyoming: $65,551 ($75,400 in 2023 dollars)
#8. Washington: $67,669 ($77,900 in 2023 dollars)
#7. New Hampshire: $67,877 ($78,100 in 2023 dollars)
#6. New York: $69,886 ($80,400 in 2023 dollars)
#5. California: $70,058 ($80,600 in 2023 dollars)
#4. New Jersey: $70,952 ($81,600 in 2023 dollars)
#3. Massachusetts: $77,371 ($89,000 in 2023 dollars)
#2. Connecticut: $77,810 ($89,500 in 2023 dollars)
#1. District of Columbia: $89,707 ($103,200 in 2023 dollars)
#10. New Hampshire: $77,260
#9. Wyoming: $77,837
#8. Colorado: $78,918
#7. New York: $79,581
#6. Washington: $79,659
#5. California: $80,423
#4. New Jersey: $80,724
#3. Connecticut: $87,447
#2. Massachusetts: $87,812
#1. District of Columbia: $100,909
Story editing by Nicole Caldwell. Copy editing by Paris Close. Photo selection by Clarese Moller.


